How Logan Square shrank
Data on deconversions and household changes — and what they can teach us about gentrification
The Logan Square neighborhood of Chicago faces a funny problem: its population is shrinking. This shrinkage has accompanied the neighborhood’s rapid gentrification: Data from the Chicago Metropolitan Agency for Planning shows that the neighborhood went from 65% Hispanic in 2000 to 35% in 2020, with a commensurate increase in the white population share. From 2010 to 2020, the inflation-adjusted median household income jumped from $66,781 to $97,759.
However, Logan Square’s population declined 2.1% from 2010 to 2022, despite Chicago’s overall population growing 1%. Over a longer period, the decline is even stronger: from 2000 to 2022, Logan Square’s population shrank 13.9% while the city’s population shrank 6%.
In a recent Tweet that generated much discussion, urbanist Naqiy Mcmullen blamed housing deconversions, where small multifamily housing — usually a building with 2 to 4 units — is retrofitted into a more expensive single-family home.
Deconversions have received much attention, including as the focus of a recent ordinance raising demolition fees on the Northwest side of Chicago. That’s no surprise, as deconversions are transparently bad — they raise the average price of housing and decrease a neighborhood’s housing stock.
As I will show in this post, however, deconversions are at most a minor contributor to Logan Square’s population decline. Changes in household sizes are much more clearly causing this population decline.
Yet more generally, we shouldn’t think of deconversions and declining household sizes as separate trends. Instead, they reflect something larger about the changing nature of housing demand under gentrification. When people with higher incomes move into a neighborhood with lower incomes, those new residents will consume more housing per person. This is a crucial dynamic to help us understand how gentrification reshapes neighborhoods.
Reviewing some data on deconversions and shrinking households
To look more closely at these trends, I’ve aggregated tract-level census data on populations and housing units across all of Chicago’s Community Areas. This data confirmed that Logan Square’s population has fallen by almost 1,000 people over the last decade, from 72,791 people in 2010 to 71,739 people in 2020.
How much could housing deconversions be driving this decline?
In 2021, the Depaul Institute for Housing Studies published a study of deconversions across Chicago. They found that from 2013 to 2019, 224 buildings with 2-4 units (representing 488 total units) were turned into single-family homes in Logan Square. That’s a net loss of 264 housing units due to deconversions, accounting for the fact that the resulting single-family home still counts as a housing unit. Over six years, losing 264 housing units to deconversions is not negligible. Extrapolating this rate of deconversions to the 10-year period between censuses could substantially explain a loss of about 1,000 people in Logan Square.
But although deconversions have eliminated some housing in Logan Square, Logan Square has also seen enough new housing construction that it’s actually gained in total housing units.
Furthermore, Logan Square is no outlier: all of its neighboring Northwest Side Community Areas, which have also seen average incomes rise in recent years, have experienced the same trend over each of the past two decades: population declining in spite of a growing housing stock. The sole exception is West Town from 2010 to 2020, which had already become a relatively high-income neighborhood by 2010.
This data motivates against the hypothesis that neighborhoods like Logan Square are losing population because deconversions are shrinking the housing supply. However, a slightly different version of this argument is worth considering: maybe deconversions have reduced the quantity of family-sized units with multiple bedrooms, while new apartments mostly contain units with 1 or two bedrooms that a family wouldn’t inhabit, mechanically driving down populations.
Seeing how Logan Square’s housing stock has changed over 10 years also suggests that this isn’t the primary reason for a shrinking population. Using data from the American Community Survey, we can look at the 10-year changes to Logan Square’s housing stock broken down by the number of bedrooms or the size of the apartment building (note that because the ACS data comes from population samples, there are margins of error in its estimates. I’ve reported p-values in parentheses that indicate whether the 10-year change is statistically significant).1
These charts confirm that Logan Square has seen more housing units in large buildings, and more 1-bedroom or studio apartments. However, there has not been a decrease in the number of units with 3 or more bedrooms — the neighborhood hasn’t substantially lost “family-sized” housing units.
These data suggest that changes in the type of housing in Logan Square are not driving the population decline.
If deconversions or differences in new buildings aren’t the primary reason for population changes, then changes to households must be. If a neighborhood has less people but more housing units, then households are shrinking.
Data from Logan Square and across the Northwest Side confirm this. Despite losing population, these gentrifying Northwest Side CCAs have all gained in total number of households since 2010. The increase in households is driven by many more one and two-person households, outpacing the decline of households with 5 or more people.
I’ll offer one more figure that helps clarify this shrinkage in households. The graph below plots populations of children and adults in the Northwest Side neighborhoods. It shows that these neighborhoods’ population decline is entirely accounted for by a decline in the population of children.
Some of this matches larger-scale shifts in Chicago, since most neighborhoods are seeing shrinking populations of children.2 Some of it is specific to gentrifying neighborhoods, where more young professionals without kids have moved into the neighborhood, and families have moved out.
What deconversions and shrinking households have in common
Framing these two trends as separate is a mistake. A simple dynamic underlies both deconversions and declining household sizes: when people have more money, they consume more housing.
Deconversions reflect the preferences of households with higher incomes and more ability to pay for floor space (see also the Chicagoan trend of bungalow pop-tops, where homeowners add a whole second floor to their small, single-family bungalows).
Similarly to deconversions, shrinking household sizes reflect an ability to pay for more housing per person. For example, people with more money can afford not to split housing costs with an extra roommate, or flexibly use a bedroom as an office space. This also means that existing families in a neighborhood struggle to compete with higher-earning households who can afford more square footage per person.3
This suggests that neither deconversions or declining households are exclusively “responsible” for Logan Square’s falling population. Both of these trends are, in part, manifestations of larger changes in housing demand that occur as higher-income residents move in.
In other words, gentrifying neighborhoods are likely to see displacement and population loss even if the housing stock is unchanged. Imagine if Logan Square had seen zero deconversions (perhaps due to a successful policy disincentivizing such redevelopment) — the same amount of housing stock would be distributed among fewer people, at a higher price.
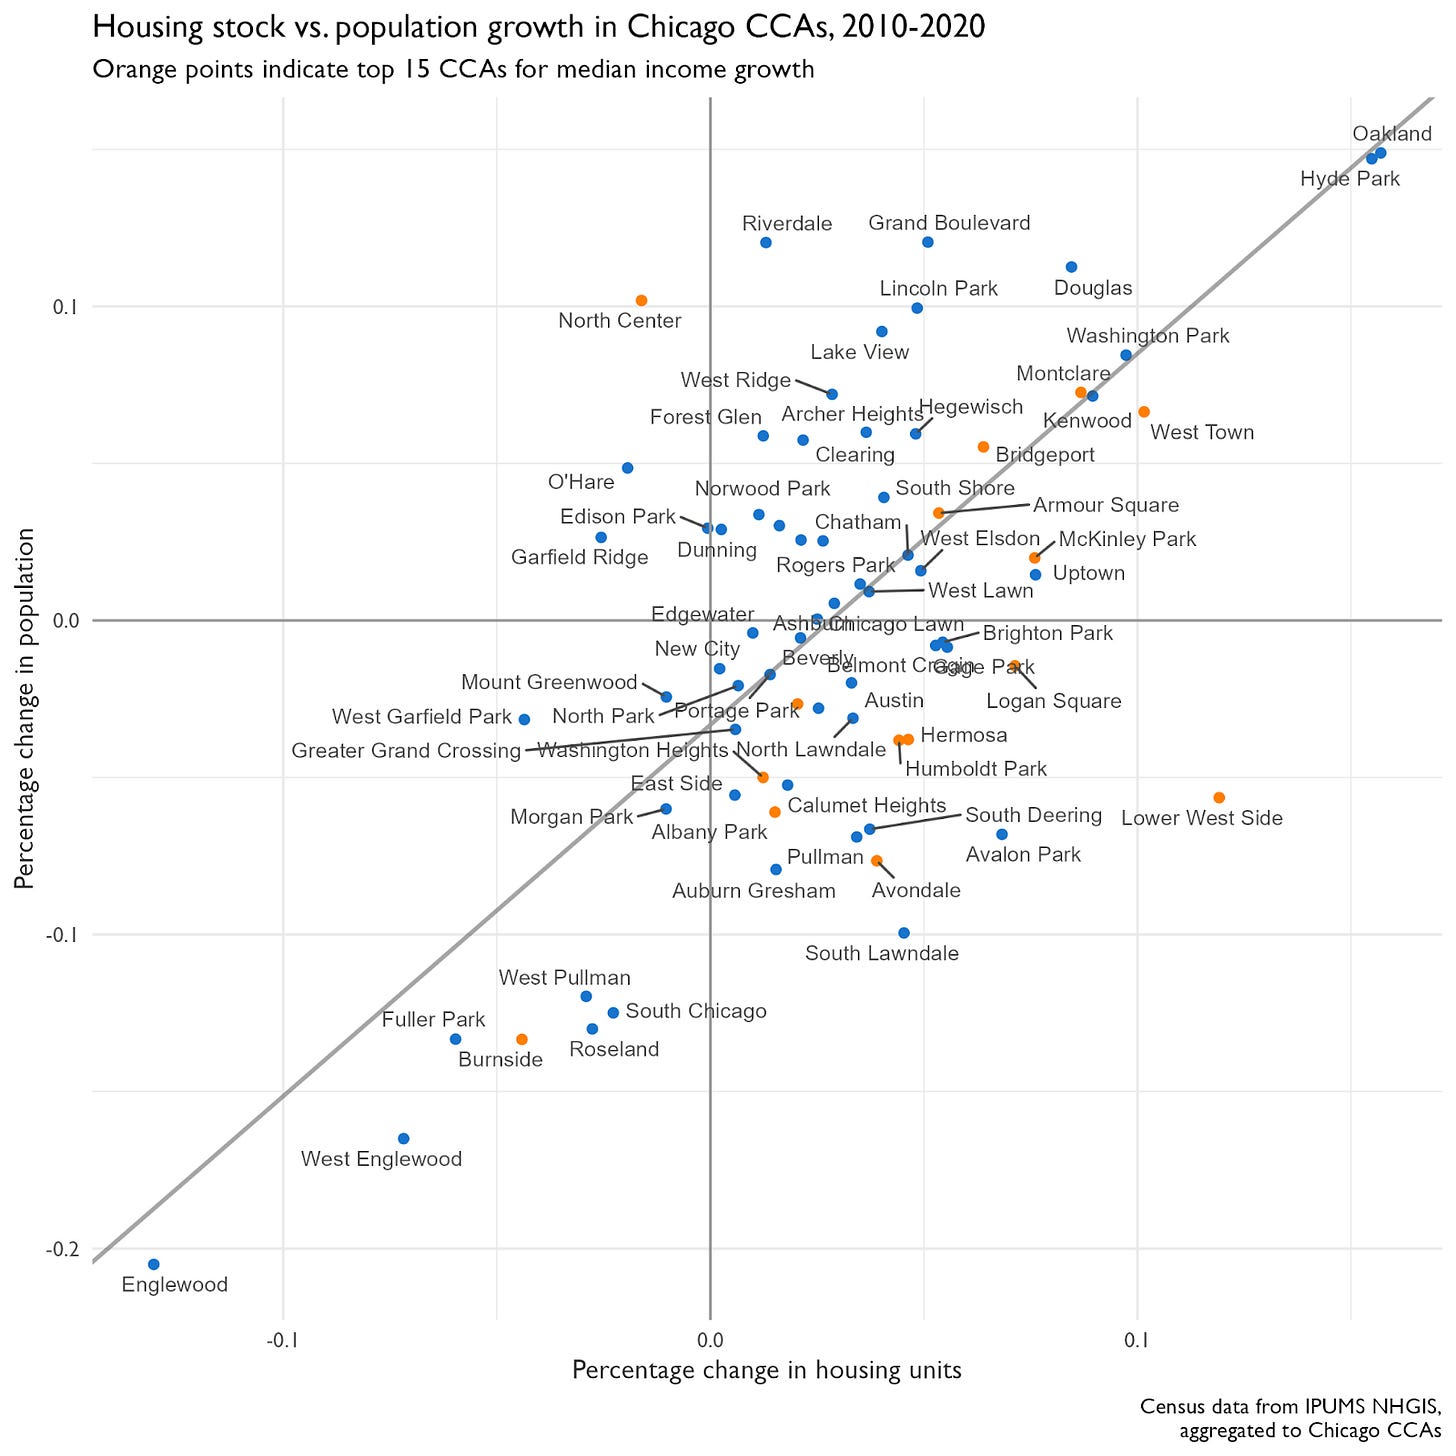
As a simple check on this hypothesis, I looked at 10-year changes in the housing stock and population for all of Chicago’s Community Areas. I also used data from CMAP to calculate the 10-year percentage increase in income for each CCA, and highlighted the 15 CCAs with the fastest income growth in orange.4
This figure shows that almost all neighborhoods with fast-growing incomes also experienced growth in their housing stock. However, quite a few of the neighborhoods with the largest income growth saw population decline concurrently with growth in the housing stock. The neighborhoods with fast-growing incomes in this bottom right quadrant include Logan Square, the Lower West Side (mostly Pilsen), and the other Northwest Side neighborhoods I’ve been showing data for, with the exception of West Town.5
The ensuing challenge
None of this is to deny that deconversions, when they do occur, are harmful. And certainly, it’s not to deny the greater harms of gentrification and displacement on longtime residents.
Instead, I think that this trend is important for us to understand if we want to keep neighborhoods more affordable in the long-term, even as they experience influxes of demand from higher-earning households. After all, we can’t do much to prevent new people from moving into a neighborhood. Instead, we need to figure out how to accommodate this demand growth while minimizing cost pressures for the existing residents.
Consider a recent Bloomberg CityLab story on the worker’s cottages of Chicago. These buildings are small, cute, and old single-family homes common in many Chicago neighborhoods, and have historically served as a lower-cost housing option. The article highlighted efforts in Logan Square to preserve worker’s cottages, which have faced similar demolition pressures as old two-flats.
These are commendable efforts, and putting worker’s cottages into a land trust might have substantial benefits for a few families. It’s also highly resource-intensive, and despite the localized benefits these trusts will provide, they’re unlikely to affect the majority of housing stock that remains on the for-sale and rental markets.
Thus, keeping a neighborhood affordable in the longer-term inevitably requires some mechanism for absorbing that increased housing demand. The housing stock needs to grow, because if it doesn’t grow, residents are locked in a zero-sum game that heavily disadvantages existing lower-income residents in the long run.
To be sure, loosening zoning and growing the housing stock won’t address short-term price spikes — people can move into a gentrifying neighborhood faster than buildings can accommodate them. Mitigating the worst effects of gentrification on incumbent residents requires other short-term measures that favor stability and subsidize low-income residents.
But as the population trends of Logan Square suggest, stability, subsidy, and supply are all necessary to keep neighborhoods affordable in the long term.
Appendix: bonus figures and some notes on the data
Extra figures
Data notes
As mentioned in the figure captions, I used the wonderful IPUMS NHGIS to pull all data used. Their tool allows users to get Census and American Community Survey data at the census tract level. The census tract boundaries were either 2010-standardized boundaries, or 2020 boundaries for some of the 2020 data. I aggregated these tracts to Chicago Community Areas using CMAP’s very handy Census tract to CCA crosswalks, which provide weights for census tracts that are split across multiple CCAs.
Population, total housing units, population over/above 18 data: From Census, 2010-standardized census tracts
Household size data: From Census, 2010-standardized census tracts for 2000 and 2010, and 2020 tracts for 2020.
Housing unit size and bedroom count data: From 2008-2012 and 2018-2022 American Community Surveys, 2010 and 2020 census tracts respectively
ACS data comes from population samples, so there are margins of error in its estimates. I’ve reported p-values in parentheses that indicate whether the 10-year change is statistically significant, approximately following this guide from the Census.
See the appendix for a map of changes in the population of children for all of Chicago’s Community Areas.
Also, once gentrification accelerates, incumbent families probably care relatively less about the new amenities, like restaurants or nightlife, that accompany gentrification — a kind of notion of “cultural displacement” from a neighborhood.
For this citywide analysis and the citywide figures in the appendix, I exclude the four downtown CCAs, because they are simply growing too fast and make comparisons difficult among the rest of the CCAs.
See the appendix for a version of this figure that labels the individual Community Areas.


Nicely done piece! To your list of variables, I would also include fertility rates, which have been declining in the US (and the globe). I believe they’ve held steady in IL, but it would go to your thesis of declining household sizes.
This is really cool. I am curious now how household incomes have grown in Chicago. Also: interesting the concentration of growing population of kids in three Northside neighborhoods.